To develop a forecast that accurately accounts for the impact of EV charging, utilities must develop two long-term utility peak demand forecasts:
- Utility peak demand without EVs, which is a traditional econometric long-term utility peak demand forecast that assumes we live in a world without EVs.
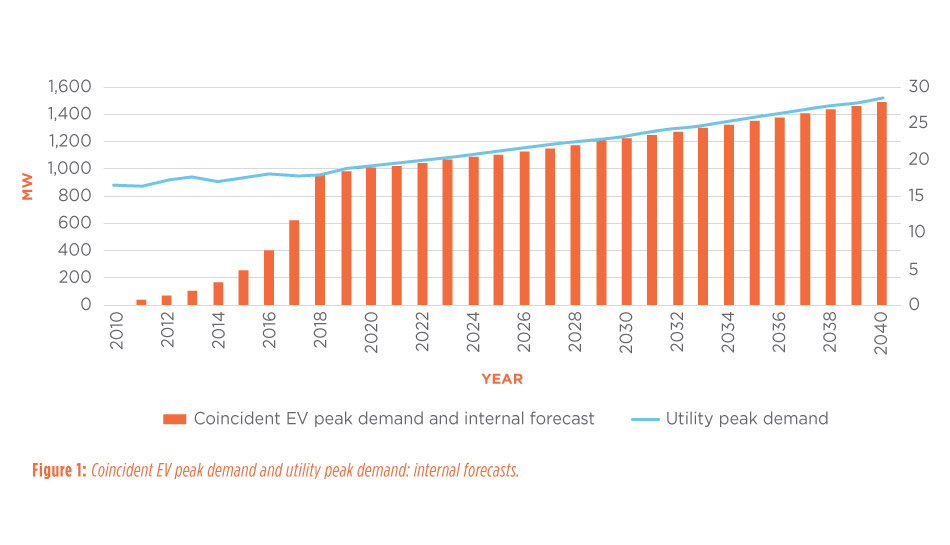
- EV coincident peak demand, which is a long-term forecast of the portion of peak demand caused solely by EV charging.
Once completed, these two forecasts can be added together to develop a more realistic long-term utility peak demand forecast.
Utility Peak Demand Without EVs
First, the historical EV coincident peak demand must be estimated for each historical year EVs were present. Vehicle registrations can be researched to determine the historical number of EVs. Next, the past charging behavior of EV drivers and the amount of power required for charging must be researched and analyzed.
For example, consider a utility in the Midwest with a summer peak that occurred at 5 p.m. on a weekday in August. The service territory penetration of EVs and EV charging patterns would need to be analyzed to estimate the historical EV coincident peak demand that occurs about that time on weekdays in August. The same exercise would then be completed for each year going back to when there were practically no EVs — such as 1997, when the first massproduced hybrid vehicle was released.
Finally, the historical EV coincident peak demand would be subtracted from the utility’s historical utility peak demand each year to determine the utility peak demand without EVs. This number then becomes the foundation for the forecast of utility peak demand without EVs.
Regression analysis is one of the most widely applied statistical methods of modeling time series data for forecasting energy and peak demand. In this technique, the historical variation (the dependent variable) is explained statistically by the historical variation in one or more other variables (the independent variables). This is a way to model cause and effect. For example, when the population of a utility’s service area increases, the number of its residential consumers increases.
The forecast of utility peak demand without EVs can now be made with industry-standard economic, demographic and other variables using regression analyses. It’s important to use economic and demographic variables and forecasts based on the utility’s service territory instead of the state as a whole because growth can vary significantly from one area to another.
EV Coincident Peak Demand: Method 1
The full forecast approach assumes that vehicle sales in the utility’s service territory will grow at the same rate as the population in that territory. The historical vehicle and EV registrations obtained above for the prior year provide a starting point for determining this rate. Next, we can obtain the historical population and published population forecasts for the utility’s service territory. Finally, we can apply forecasted population growth to the historical vehicle registrations to obtain the vehicle forecast for the territory, knowing that historical growth in vehicle sales should be comparable to historical vehicle sales and historical population growth.
Various sources provide long-term EV growth projections. For example, the EEI predicts that 20% of new vehicle sales will be electric vehicles by 2030, while the Electric Power Research Institute (EPRI) predicts that number could be as high as 38%. A fair approach is to merge historical EV growth with these longer-term EV growth projections. The next step is to apply the estimated percentage of new EV sales to the forecast of new vehicles in the utility’s service territory, as developed above. In-between years would need to be interpolated. Now, we have an EV forecast for the utility’s service territory.
Next, the forecasted number of EVs in the utility’s service territory, estimated charging quantities and the future charging behavior of EV drivers must be analyzed together to develop the forecast of EV coincident peak demand.
EV Coincident Peak Demand: Method 2
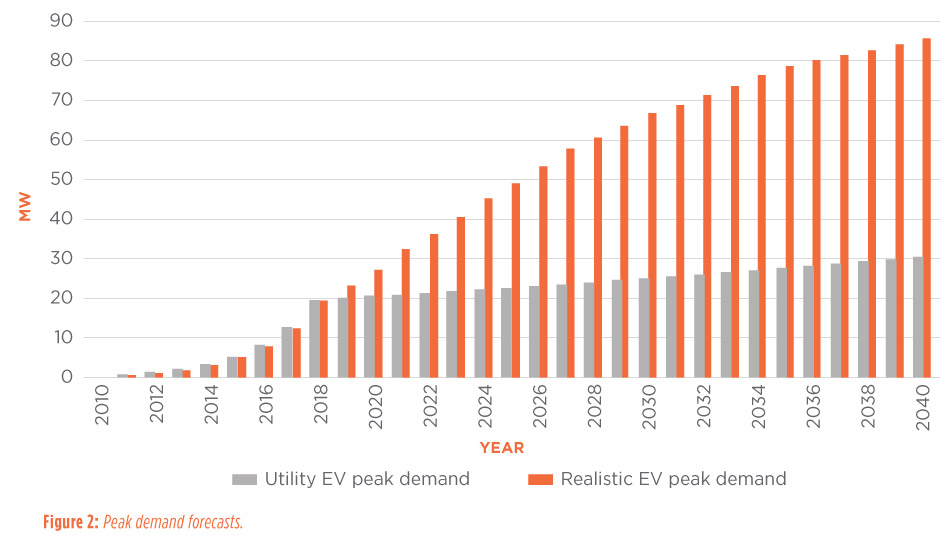
Alternatively, the annual growth rates from the EV forecast for the utility’s service territory can be applied to the last year of historical EV coincident peak demand. This provides the forecast of EV coincident peak demand, which can then be added to the utility peak demand without EVs to obtain a better utility peak demand forecast. Comparing the EV coincident peak demand forecast to the new utility peak demand forecast shows the impact of EVs on utility peak demand. This method assumes both similar charging patterns and that EVs would require the same quantity of power to charge in the future as in the past.


.svg)